The Chinese Stock Market
Sectors, Major Players, and a Century of Booms, Busts & Reinvention
⤓ Download PDFExecutive Summary
China's equity markets are the world's second largest by capitalization, with over 5,400 listed A-share companies commanding a combined market cap of RMB 123 trillion (USD 17.5 trillion) as of end-2025.1 Yet this vast market is barely three decades old in its modern form -- the Shanghai and Shenzhen exchanges reopened only in December 1990, after a four-decade hiatus under central planning. The story of Chinese equities is one of extraordinary reinvention: from Asia's premier bourse in the 1930s, to total extinction under Mao, to a volatile but globally significant capital market that has survived bubbles, crashes, regulatory upheavals, and geopolitical storms.
The market's structure has undergone a generational shift. Financials, which once comprised over 40% of the CSI 300, have halved to 22.6%, while information technology has tripled to nearly 20%.2 The "old China" of state-owned banks and property developers is giving way to a "new China" of EV batteries (CATL), AI chips (Cambricon), and platform giants (Tencent, Alibaba). BYD, a company that barely existed as an automaker a decade ago, is now China's most valuable listed company at roughly USD 894 billion.3
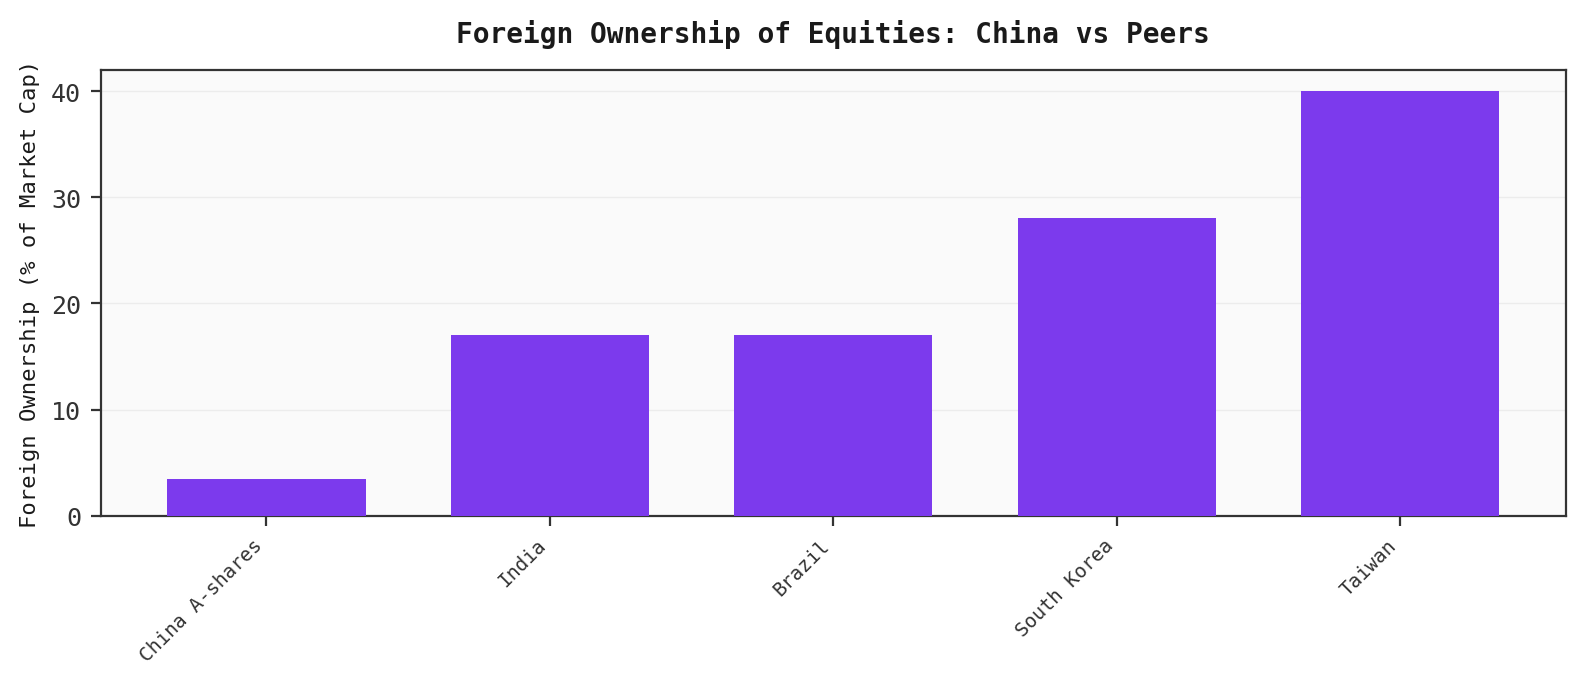
Yet long-term returns have been structurally disappointing. The SSE Composite has delivered an annualized return of just 0.8% in the 2010s, and the Hang Seng Index remains below its October 2007 peak nearly two decades later.4 Violent boom-bust cycles -- the 2007 bubble (SSE 6,124), the 2015 leveraged crash, the 2021 tech crackdown, and the 2022-2024 property crisis bear market -- have punished buy-and-hold investors while rewarding traders who timed policy pivots. Foreign ownership of A-shares remains a remarkably low 3-4% of market cap, far below India (17%), South Korea (28%), and Taiwan (40%).5
As of April 2026, the market trades at 12.8x forward earnings with consensus expecting 14-15% earnings growth, supported by monetary easing, AI-driven tech re-rating, and a cautious policy pivot toward supporting the private sector.6
Key Takeaway
China's stock market is vast, volatile, and structurally evolving. It rewards understanding of policy cycles and sector rotation far more than passive indexing. The shift from "old China" to "new China" is the defining investment theme of this decade.
A Century of Chinese Capital Markets
Origins: Shanghai as Asia's Wall Street (1860s-1949)
Securities trading in Shanghai dates to June 1866, when a list of thirteen foreign companies appeared in a local English-language newspaper.7 By 1891, foreign merchants had established the Shanghai Sharebrokers' Association -- China's first formal stock exchange, operating under British commercial law in the International Settlement.
The market's first crisis came early. The rubber stock bubble of 1910 saw speculation in plantation shares reach fever pitch, with price-to-book ratios of 10-20x. When international rubber prices collapsed, 48 of Shanghai's 91 native banks (53%) went bankrupt, with losses totaling 19.3 million Tael. The financial panic contributed to the pressures that triggered the 1911 Xinhai Revolution.8
By the 1930s, Shanghai was the financial capital of the Far East and the largest equities market in Asia. Orders could be transmitted to the New York Stock Exchange in sixteen minutes. Chinese-run exchanges had merged with the foreign bourse into a unified Shanghai Stock Exchange.9 This golden era ended abruptly on December 8, 1941, when Japanese troops occupied the International Settlement. A brief postwar reopening proved unsustainable amid hyperinflation and civil war.
The Void: 1949-1990
After October 1, 1949, the new People's Republic closed the Shanghai Stock Exchange and nationalized its assets. For four decades under central planning, no public securities markets existed. By 1978, nearly three-quarters of industrial production came from state-owned enterprises operating under planned output targets, and only 3% of commodity prices were market-determined.10
Rebirth: The 1990 Reopening
The revival began tentatively in the mid-1980s under Deng Xiaoping's reforms. Shanghai Feile Acoustics issued the first PRC shares in November 1984 (10,000 shares at 50 yuan each), and the first over-the-counter stock trades occurred on September 26, 1986, at an ICBC branch in Shanghai.11
The SSE formally reopened on December 19, 1990, with eight A-shares -- the famous "Old Eight Stocks" (Lao Ba Gu) -- and 17 treasury bonds. Mayor Zhu Rongji presided over the ceremony at the Pujiang Hotel before 500 dignitaries.12 The Shenzhen Stock Exchange began trial operations on December 1, 1990, initially without Beijing's full blessing -- its brass plaque was famously covered with red cloth.
Deng's Southern Tour in early 1992 unleashed market mania. Shanghai Yuyuan Company shares surged from 100 yuan to 4,329 yuan by mid-March.13 But growth brought chaos: the August 1992 Shenzhen share-subscription riot, where over one million people queued for lottery tickets and violence erupted when forms ran out, forced Beijing to establish the China Securities Regulatory Commission (CSRC) in October 1992 -- the regulator that governs the market to this day.14
Modern Market Architecture
China operates a multi-tiered capital market across four exchanges, with a unique share-class system reflecting its controlled capital account.
| Exchange | Market Cap (Feb 2026) | Listed Companies | Key Feature |
|---|---|---|---|
| SSE (Shanghai) | USD 8.9T | ~2,400+ | Main board + STAR Market (tech, launched 2019) |
| SZSE (Shenzhen) | USD 5.1T | ~2,700+ | Main board + ChiNext (growth, launched 2009) |
| BSE (Beijing) | RMB 922B | 274 | SME-focused, launched Nov 2021 |
| HKEX (Hong Kong) | ~USD 5T+ | 2,665 | Offshore gateway; 76.5% of market cap is mainland companies |
Share Classes
The A/B/H system is a legacy of China's capital controls. A-shares (RMB-denominated, 5,469 companies) are the core domestic market, accessible to foreigners via QFII and Stock Connect. H-shares are mainland companies listed in Hong Kong, typically trading at 10-30% discounts to their A-share counterparts. B-shares (USD/HKD-denominated) are a largely superseded legacy class. VIE structures allow foreign investors to hold economic interests in sectors restricted from foreign ownership (internet, media, telecom) -- 68.8% of all US-listed Chinese companies use this structure, including Alibaba, Tencent, and Baidu.15
Regulatory Framework
The CSRC completed a landmark shift from approval-based to registration-based IPOs in February 2023, transferring vetting power to the exchanges themselves.16 Trading operates under T+1 settlement with daily price limits of +/-10% on main boards, +/-20% on ChiNext/STAR, and +/-30% on BSE. China's brief experiment with circuit breakers in January 2016 -- which triggered market-wide halts on two of the first four trading days before being abandoned -- remains a cautionary tale about poorly calibrated market mechanisms.17 Short selling has been progressively restricted since early 2024, with outstanding short positions falling 64% after CSRC intervention.18
Sector Landscape
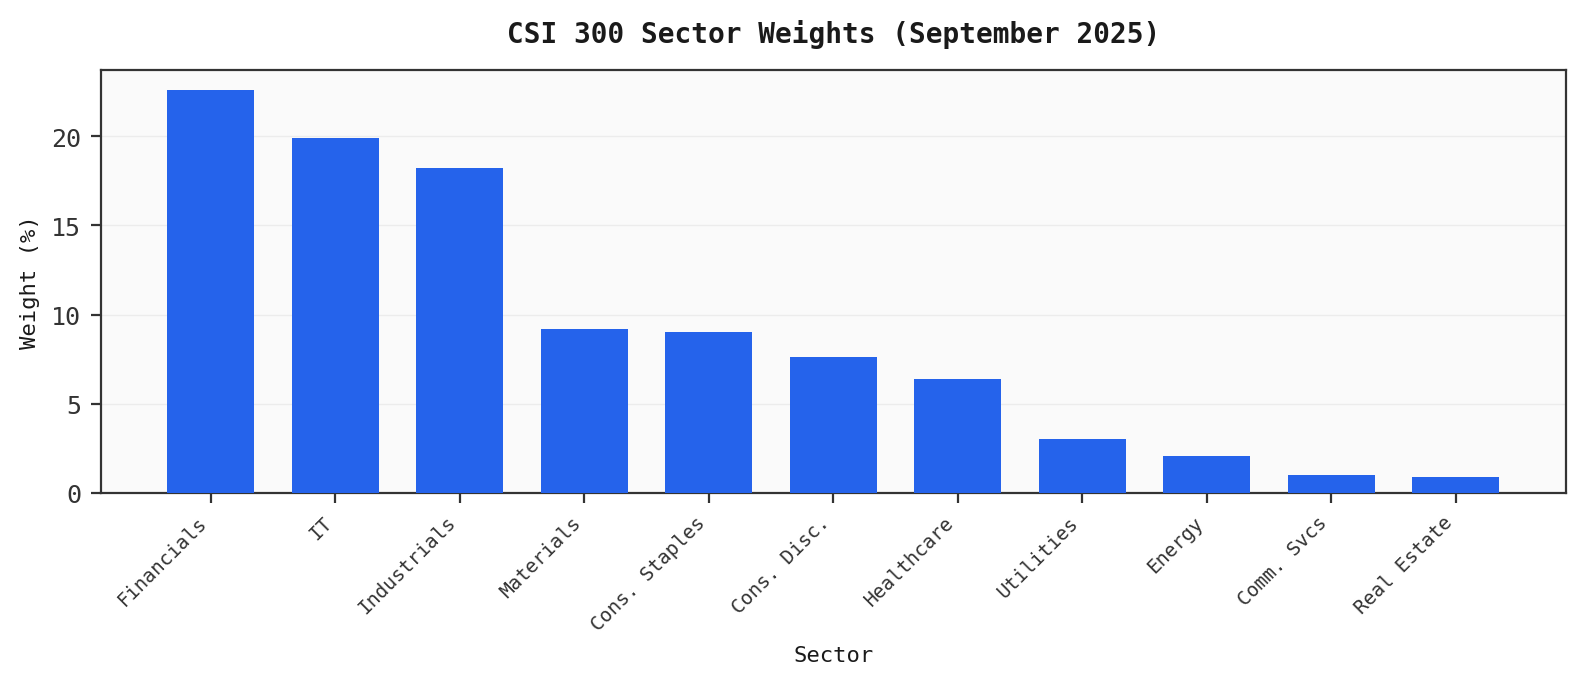
The CSI 300's sector composition tells the story of China's economic transformation.
| Sector | CSI 300 Weight (%) | S&P 500 Weight (%) | Delta |
|---|---|---|---|
| Financials | 22.6 | 12.9 | +9.7 |
| Information Technology | 19.9 | 31.3 | -11.4 |
| Industrials | 18.2 | 8.7 | +9.5 |
| Materials | 9.2 | 2.0 | +7.2 |
| Consumer Staples | 9.0 | 6.1 | +2.9 |
| Consumer Discretionary | 7.6 | 10.4 | -2.8 |
| Healthcare | 6.4 | 9.3 | -2.9 |
| Real Estate | 0.9 | 1.9 | -1.0 |
The structural shift is unmistakable. Financials have roughly halved from over 40% of the CSI 300 in 2010 to 22.6% in 2025. Information technology has tripled from around 6% to nearly 20%, driven by the STAR Market (launched July 2019), which attracted semiconductor, biotech, and advanced manufacturing IPOs.2 Consumer staples grew from 5% to 9%, anchored by Kweichow Moutai's extraordinary price appreciation. Real estate collapsed from approximately 4-5% to just 0.85% following the Evergrande-triggered property crisis.19
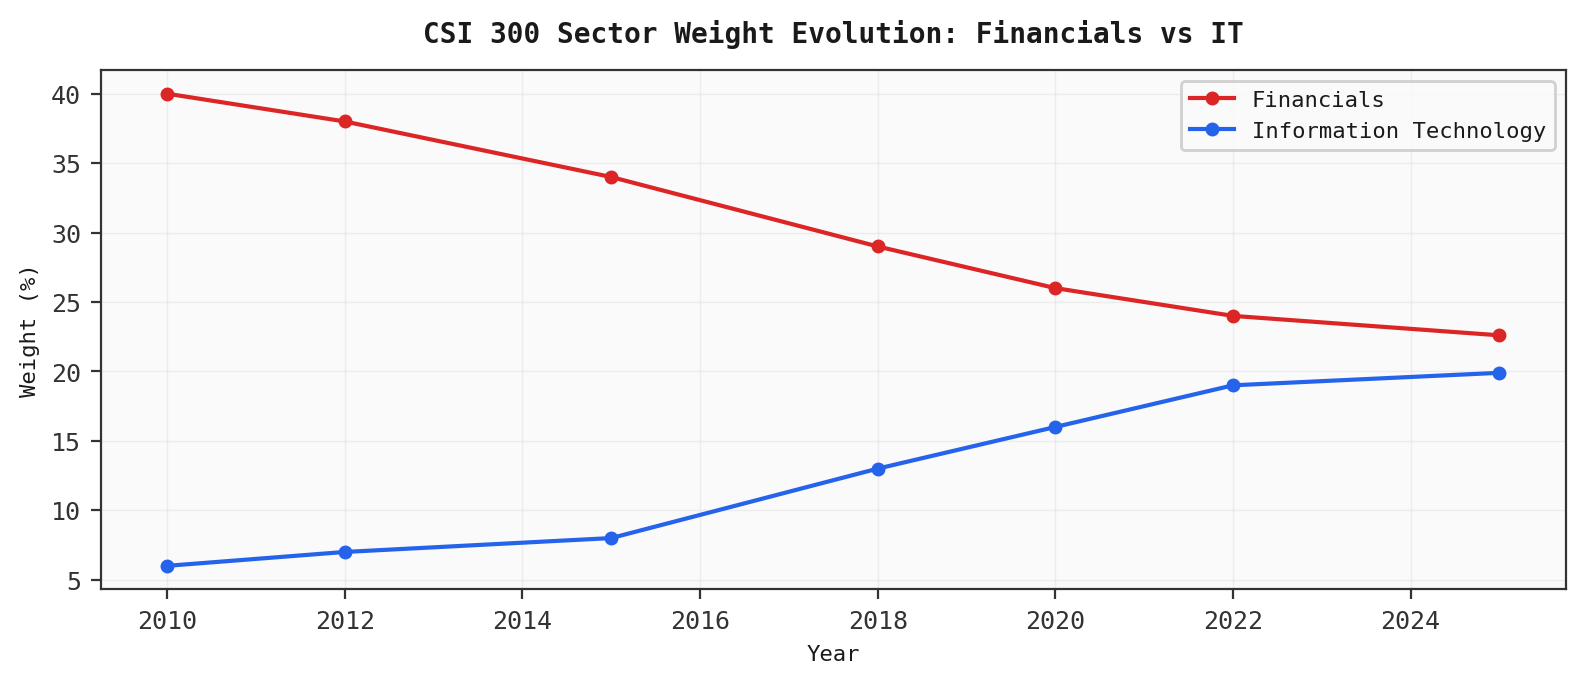
The "old China" sectors (banks, insurance, property, heavy industry) have declined from roughly 50% of the index to 35%, while "new China" sectors (technology, new energy, biotech, advanced manufacturing) have risen from 15-20% to 35-40%.2 This transformation was catalyzed by the STAR Board's tech IPO channel, the "dual circulation" policy prioritizing domestic tech capability, US-China technology sanctions driving semiconductor self-sufficiency, and China's 2060 carbon neutrality pledge fueling a new energy investment boom.
The composition gap between onshore A-shares and the offshore MSCI China index is critical. The MSCI China, which includes Hong Kong and ADR listings, has consumer discretionary at 28% and communication services at 22% -- reflecting Alibaba and Tencent, which are not in the CSI 300.20 Investors looking for "China tech" exposure must look offshore.
Valuations remain cheap by global standards. The CSI 300 trades at approximately 14-15x trailing earnings, versus 22-24x for the S&P 500. Chinese banks trade at 5-7x P/E and 0.6x P/B. Consumer staples command 25-35x, while semiconductor names reach 40-80x, reflecting the strategic self-sufficiency premium.21
Major Players by Sector
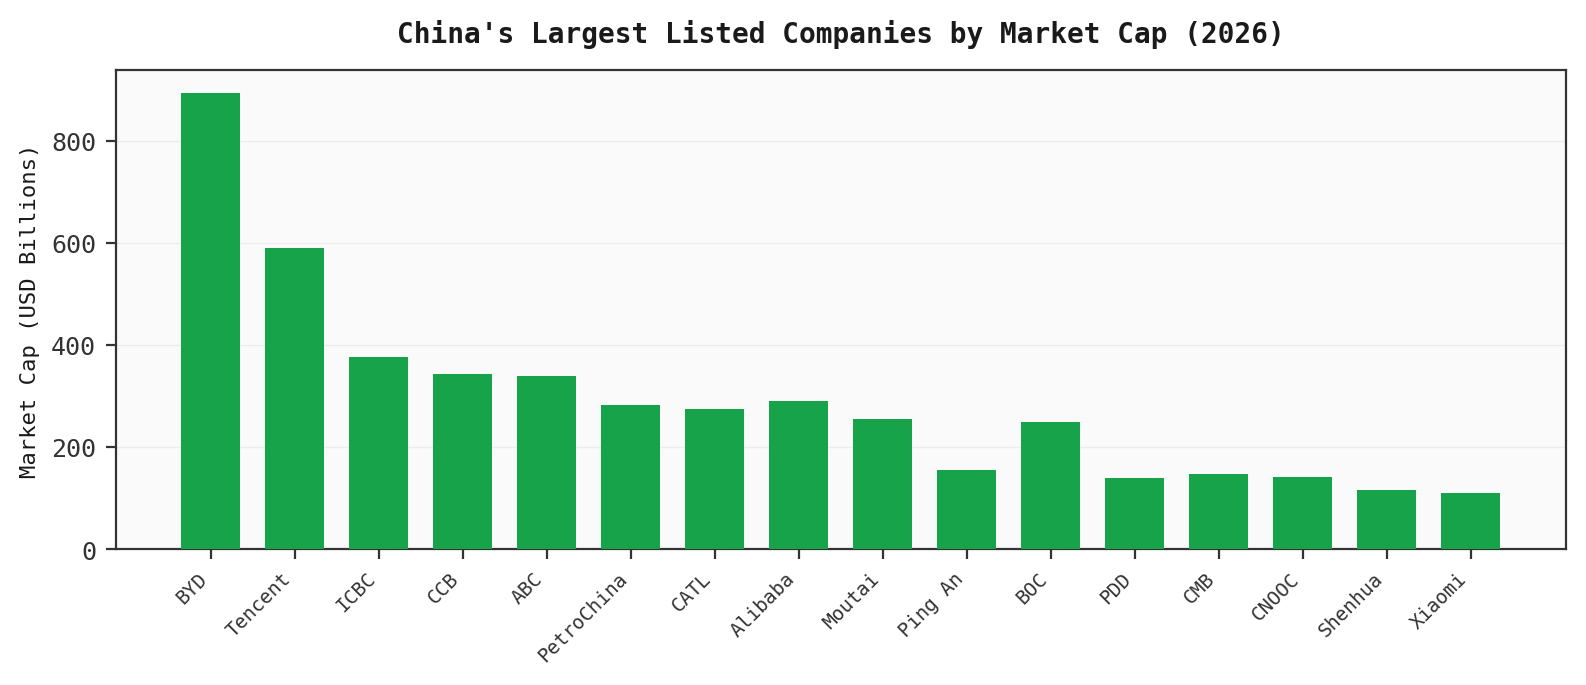
Financials: The World's Largest Banks at the World's Cheapest Valuations
China's "Big Four" state banks -- ICBC (USD 376B), CCB (USD 343B), ABC (USD 338B), and BOC (USD 248B) -- are the four largest banks in the world by total assets, yet trade at an average P/B of just 0.61x.22 The discount reflects compressed net interest margins (as the PBOC cuts lending rates to support growth), property sector NPL exposure, local government financing vehicle (LGFV) risks, and policy-directed lending that sacrifices profitability for social objectives. China Merchants Bank (USD 147B) stands apart as the best-run joint-stock bank, commanding a higher P/B premium.
Ping An Insurance (USD 155B) is China's largest insurer by market cap, operating as an integrated financial conglomerate spanning life/health/property insurance, banking, fintech, and healthcare technology.23 CITIC Securities (USD 53B) leads the brokerage sector.
The silver lining of compressed valuations is attractive dividend yields -- Chinese banks often yield 5-7%, making them "stock market darlings" for yield-seeking domestic institutional capital in a low-rate environment.24
Technology: Platform Maturation and the Self-Sufficiency Premium
| Company | Exchange | Market Cap | Core Business |
|---|---|---|---|
| Tencent | HKEX | ~USD 590B | Gaming, WeChat (1.3B MAU), fintech, cloud |
| Alibaba | HKEX/NYSE | ~USD 290B | E-commerce, cloud, logistics |
| PDD Holdings | NASDAQ | ~USD 140B | Value e-commerce (Pinduoduo/Temu) |
| Xiaomi | HKEX | ~USD 109B | Smartphones, IoT, EVs (SU7) |
| SMIC | HKEX/SSE | ~USD 86B | China's largest semiconductor foundry |
| Cambricon | SSE STAR | ~USD 79B | AI accelerator chips ("China's NVIDIA") |
The era of hyper-growth for Chinese internet platforms is over. Tencent and Alibaba now trade on earnings growth and capital returns (buybacks, dividends) rather than revenue growth.25 PDD/Temu remains the last high-growth story, but profitability questions loom as international expansion burns cash.
The semiconductor sub-sector has exploded in strategic importance and valuation. SMIC achieved 7nm-class chip production for Huawei's Kirin processors despite lacking EUV lithography -- a feat many believed impossible under US sanctions.26 Cambricon's USD 79B market cap, on minimal historical revenue, reflects the enormous premium investors place on domestic AI chip self-sufficiency. NAURA Technology (USD 49B), China's largest semiconductor equipment maker, benefits from equipment localization as US export controls restrict sales by ASML, Applied Materials, and Lam Research.27
Two unlisted companies loom large: ByteDance (TikTok/Douyin parent, ~USD 550B private valuation, ~USD 50B profit in 2025) and Huawei (~USD 118B revenue, HiSilicon chip breakthrough).28
Consumer: The Moutai Premium and the EV Revolution
Kweichow Moutai (SSE, USD 254B) remains the single most valuable A-share stock and a cultural institution. Its 67% operating margin, 86% five-year ROIC, and near-inelastic demand among wealthy Chinese consumers make it an unparalleled franchise. Authentic Moutai can only be produced in the town of Maotai, Guizhou, due to the unique local microbiome. Bottles appreciate over time, creating a secondary market where vintage Moutai trades at multiples of retail price.29
BYD (SZSE/HKEX, USD 894B) is the sector's standout story. It sold 4.6 million vehicles in 2025, overtaking Tesla as the world's top EV seller. Combined with its vertically integrated battery and semiconductor operations, BYD's market cap approaches USD 1 trillion. Chinese firms now control roughly 70% of the global EV battery market, with CATL (39.2% share) and BYD (16.4%) dominating.3
Energy: The Fossil-Renewable Barbell
PetroChina (USD 282B), CNOOC (USD 141B), and Sinopec (USD 108B) remain cash-flow machines trading at low single-digit P/Es with high dividend yields. China Shenhua Energy (USD 116B) is the world's largest coal company by market cap.30 Yet China simultaneously invested more in clean energy than any other country in 2024 -- USD 625 billion, or 39% of the global total. Yangtze Power (USD 97B) is the world's largest listed hydropower company. LONGi Green Energy (USD 21B), once the world's solar leader, has been battered by brutal oversupply.31
Industrials: CATL and the Battery Kingdom
CATL (SZSE, USD 275B) is the world's dominant EV battery manufacturer, with 39.2% global market share and domestic share exceeding 50% in Q1 2026.32 It is by far China's most valuable industrial company. Other notable industrials include CRRC (USD 27B, world's largest rolling stock manufacturer), Sany Heavy Industry (USD 31B, construction equipment), and the defense-linked AVIC subsidiaries.33
Index Performance & Price History
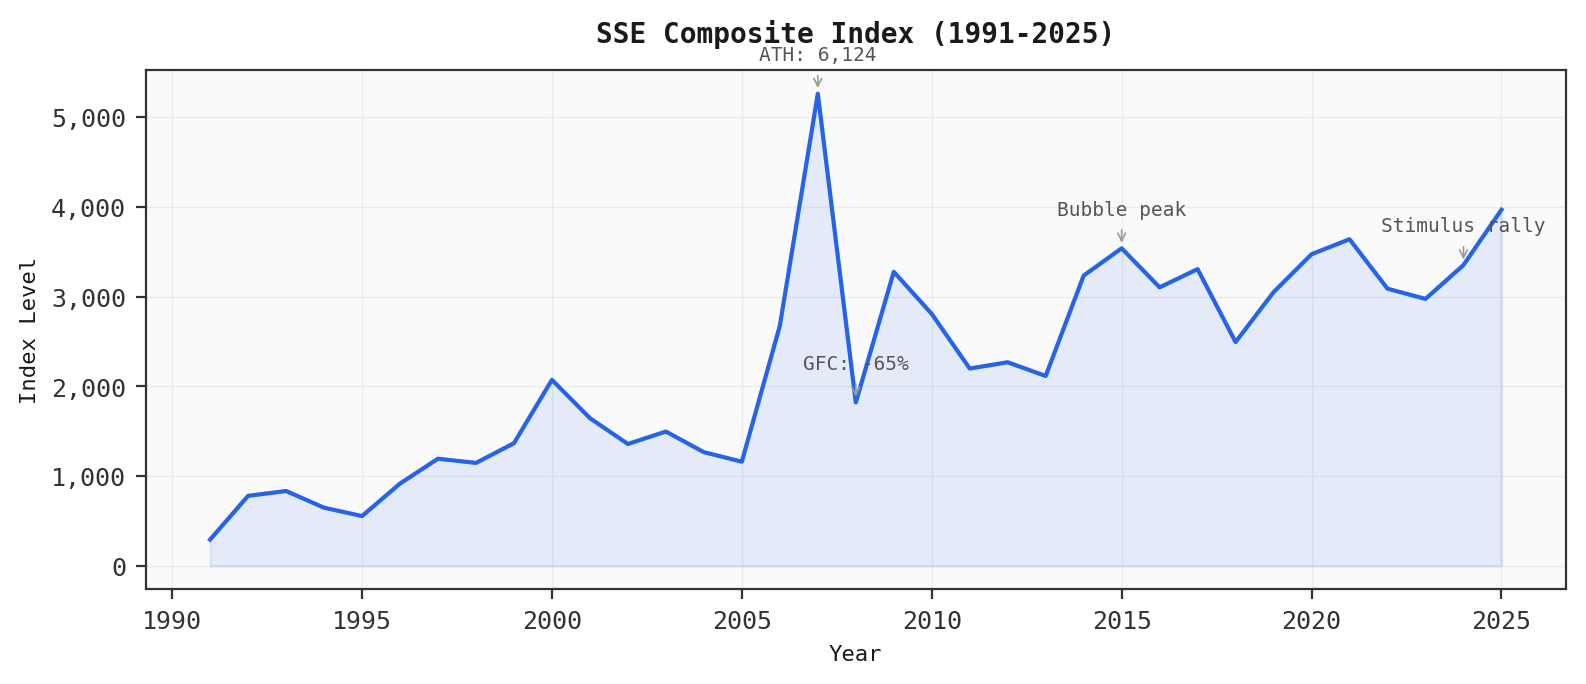
SSE Composite: 35 Years of Boom and Bust
The SSE Composite launched at a base of 100 in December 1990 and reached approximately 3,969 by end-2025 -- a nominal gain of nearly 4,000% that masks violent drawdowns and long stretches of zero real return.4
| Decade | Annualized Return |
|---|---|
| 1990s | +26.8% |
| 2000s | +4.7% |
| 2010s | +0.8% |
| 2020s (6 yrs) | +2.3% |
After an explosive inaugural decade, the SSE Composite delivered negligible real returns. The 2000s appear decent only because of the 2006-2007 mega-rally; excluding that two-year period, the decade was deeply negative. From the October 2007 all-time high of 6,124, the annualized return to April 2026 is approximately -2.4% -- a lost generation for buy-and-hold investors.
CSI 300: The Institutional Benchmark
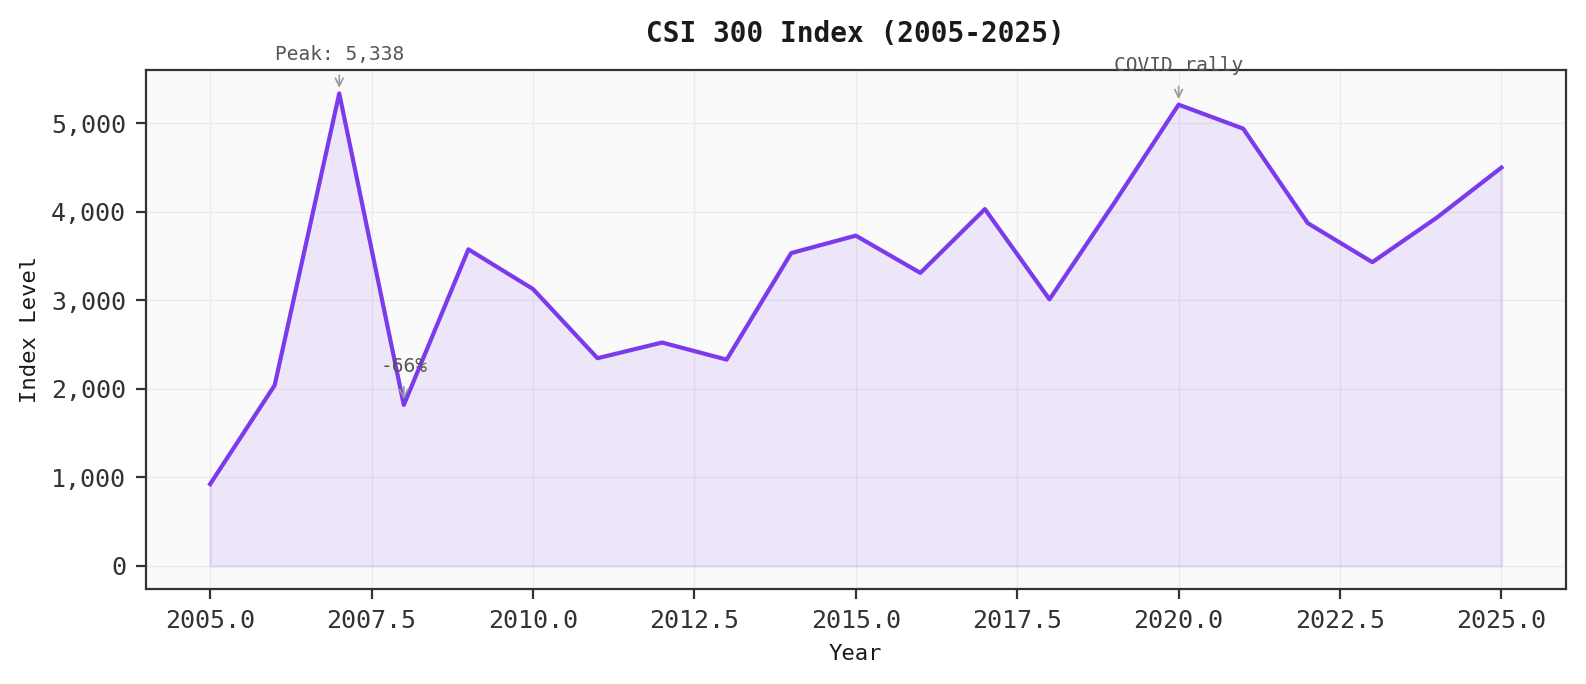
The CSI 300 (top 300 A-shares by market cap and liquidity) has delivered approximately 8.2% annualized since its 2005 inception -- narrowly trailing the S&P 500 on price return but significantly underperforming on total return due to higher US dividend reinvestment and far greater volatility. The CSI 300 was up 161.6% in 2007, then down 66% in 2008.34
Hang Seng: Two Lost Decades
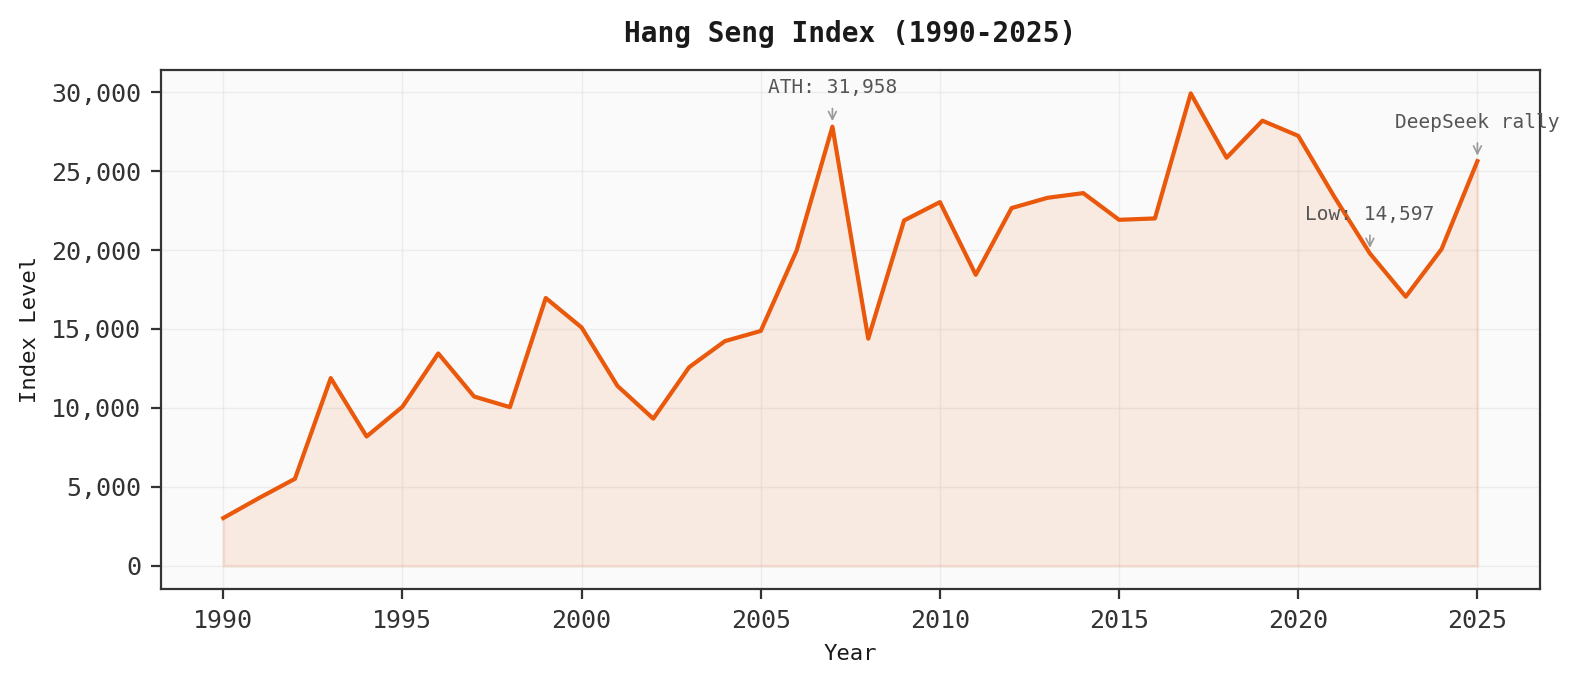
The Hang Seng Index peaked at 31,958 on October 30, 2007. Nearly two decades later, it trades at approximately 26,797 -- still 16% below that peak.35 The index touched a 13-year low of 14,597 in October 2022 during the property crisis and zero-COVID lockdowns. Its recovery to 25,631 by end-2025, driven largely by the DeepSeek AI rally and southbound capital flows, has been dramatic but incomplete.
MSCI China: Worst Among Peers
MSCI China has been one of the worst-performing major country indices over the past five years, with estimated annualized returns of roughly -2% versus +12% for MSCI World. The 2021-2023 stretch of three consecutive down years (-21.7%, -21.9%, -11.2%) represented a cumulative loss of approximately 46%.36
Landmark Events & Market Shocks
The Split-Share Reform Bull Run (2005-2007)
Before 2005, roughly two-thirds of all shares on China's exchanges were non-tradable, held by the state and SOEs. The reform required non-tradable shareholders to compensate public shareholders (via bonus shares, warrants, or cash) in exchange for the right to eventually sell. By end-2007, over 97% of market capitalization had completed the reform.37
The SSE Composite surged from 998 (June 2005) to 6,124 (October 16, 2007) -- a 514% gain in 28 months. Trading accounts exceeded 100 million for the first time. P/E ratios surpassed 70x at the peak. A PBOC survey found over 40% of Chinese residents favored stock investment over savings deposits -- a first.37
The 2008 GFC (-72.8%)
The SSE crashed from 6,124 to approximately 1,664 by October 2008, one of the largest percentage declines of any major global index during the crisis. China's RMB 4 trillion (USD 586 billion) stimulus -- announced November 9, 2008 -- made it the first major economy to recover, with GDP growth returning above 10% by mid-2009. But the stimulus planted the seeds of subsequent property-sector leverage.38
The 2015 Leveraged Bubble and Crash
Outstanding margin loans surged from RMB 698 billion to RMB 2.7 trillion as the SSE rose from approximately 2,000 (mid-2014) to 5,178 (June 12, 2015). When the bubble burst, over 1,400 companies -- more than half of all listed firms -- filed trading halts simultaneously. The "national team" spent approximately RMB 1.6 trillion buying shares of over 1,000 companies. China's January 2016 circuit breaker experiment lasted exactly four trading days before being scrapped, after the market shut down within 27 minutes of opening on the second trigger day.39
The 2018 Trade War
Trump-era tariffs sent the SSE from approximately 3,500 to 2,449 (December 2018), a decline of roughly 30%. The arrest of Huawei CFO Meng Wanzhou on December 1, 2018, signaled that the conflict extended beyond trade into technology and national security.40
COVID-19: Crash and V-Shaped Recovery (2020)
The SSE fell 7.7% on February 3, 2020 -- the first trading day after the extended Lunar New Year holiday -- shedding USD 375 billion in a single session. The PBOC injected RMB 1.2 trillion via reverse repos the same day. China's aggressive containment and factory reopenings drove a V-shaped recovery; the CSI 300 hit an all-time high of 5,808 by February 2021.41
The Tech Regulatory Crackdown (2020-2021)
Jack Ma's provocative speech at the Bund Finance Summit on October 24, 2020, criticizing regulators, triggered a cascade: Ant Group's USD 34.5 billion IPO was suspended on November 3; Alibaba was fined RMB 18.2 billion for monopolistic practices; Didi was investigated two days after its NYSE IPO and eventually forced to delist; the "Double Reduction" policy destroyed the USD 100 billion private education industry overnight.42 The crackdown erased an estimated USD 1.5 trillion from Chinese tech stocks. The KWEB ETF lost over 75% from its February 2021 peak.
Property Crisis and "China Uninvestable" (2022-2024)
Evergrande defaulted on offshore bonds in December 2021 with total liabilities of RMB 2.43 trillion. Country Garden, once considered a model developer, followed in October 2023. Zero-COVID lockdowns compounded the damage. Net FDI swung from +USD 334 billion (2021) to -USD 154 billion (2024). Foreign investors pulled RMB 90 billion from A-shares via Stock Connect in August 2023 alone -- a record monthly outflow.43
The September 2024 Stimulus Bazooka
On September 24, 2024, PBOC Governor Pan Gongsheng unveiled coordinated RRR cuts, rate cuts, mortgage relief, and stock market support tools. The CSI 300 surged approximately 25-30% in three weeks. Turnover hit a record RMB 3.4 trillion on October 8, the first trading day after Golden Week. The rally faded when the NDRC failed to announce major fiscal follow-through, but marked a clear policy inflection point.44
The DeepSeek AI Rally (2025)
DeepSeek's R1 reasoning model, released January 20, 2025, achieved performance comparable to frontier US models at a fraction of the training cost. The Hang Seng Tech Index surged 28.5%. Alibaba rallied over 60%. Xi Jinping convened a rare summit with tech CEOs on February 17, with Jack Ma attending publicly for the first time since 2020 -- a powerful symbolic signal that the crackdown era was over.45
Foreign Access & Capital Flows
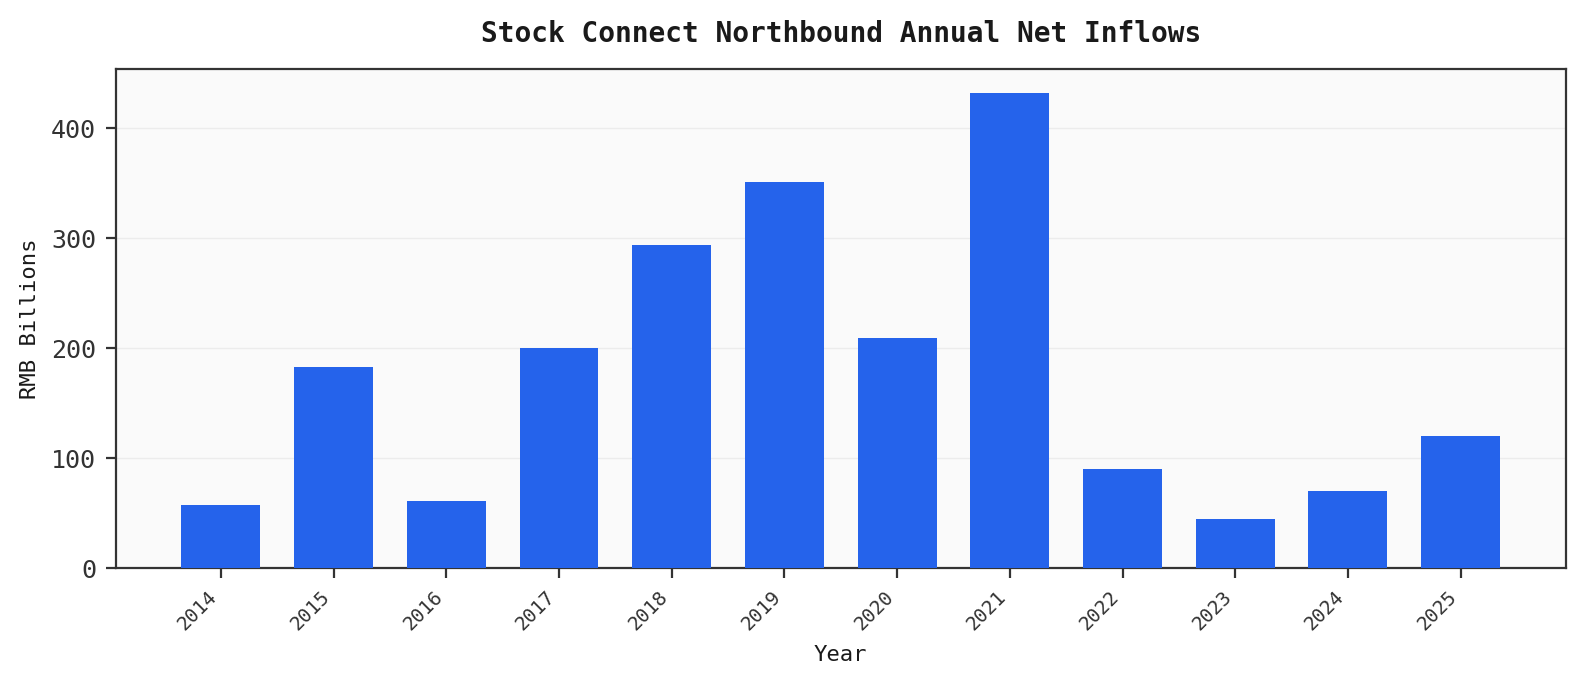
China's equity markets have evolved from near-total closure to a multi-channel access framework, yet foreign participation remains strikingly low.
The Access Architecture
QFII (Qualified Foreign Institutional Investor), launched in November 2002, was the first channel for foreign access to A-shares. After years of quota constraints, all aggregate limits were abolished in June 2020. As of September 2025, 913 institutions from 40+ countries hold QFI licenses.46
Stock Connect (Shanghai-Hong Kong launched November 2014, Shenzhen-Hong Kong in December 2016) has become the dominant access channel, facilitating approximately RMB 177 trillion in cumulative two-way flows over a decade. Northbound average daily turnover surged 42% year-on-year in 2025 to RMB 212.4 billion. Southbound flows (mainland investors buying Hong Kong stocks) surged 151%, reaching 23% of Hong Kong cash equities turnover by Q4 2025.47
MSCI Inclusion reached a 20% inclusion factor for A-shares in November 2019 but has stalled. Five unresolved issues -- hedging access, settlement cycle mismatches, trading suspensions, holiday misalignment, and omnibus account restrictions -- prevent further increases. At full inclusion, A-shares would represent over 20% of the MSCI EM Index, potentially driving USD 400+ billion in passive inflows.48
Foreign Ownership: Structurally Low
At approximately 3-4% of A-share market cap, China's foreign ownership is dramatically below all major emerging market peers. Foreign-held A-share value peaked at end-2021 and declined roughly 30% to RMB 2.8 trillion by end-2023.5
US-Listed ADRs
The PCAOB secured complete audit inspection access to Chinese firms in December 2022, resolving the most acute delisting threat under the HFCAA. As of March 2025, 286 Chinese companies remain listed on US exchanges with USD 1.09 trillion in combined market cap. Approximately 69% of ADR market value has established secondary or dual-primary listings in Hong Kong as a structural hedge.49
Current State & Outlook
As of April 1, 2026, the SSE Composite trades near 3,949 and the CSI 300 near 4,688. The Hang Seng advanced nearly 30% in 2025, driven by the DeepSeek AI rally and southbound capital flows.6
Valuation Context
The CSI 300 trades at approximately 12.8x forward earnings versus a 14.2x five-year average -- mid-range by historical standards but attractive relative to the S&P 500 at 22-24x. Consensus expects 14-15% CSI 300 earnings growth in 2026.
Policy stance: The PBOC remains on an easing trajectory. SASAC has introduced stock price performance as a KPI for SOE managers, driving A-share dividend payout ratios to approximately 35% in 2025 (up from 30% in 2024).50 The anti-involution agenda discourages ruinous price wars across industries, engineering margin recovery.
Risks remain material. Trump tariffs on China stand at approximately 47%. US-China technology sanctions continue to constrain semiconductor access. The property crisis, now in its fourth year, continues to weigh on consumer confidence and bank balance sheets. Regulatory unpredictability -- the defining risk of Chinese equities -- has moderated since Xi's February 2025 tech CEO summit, but one speech does not eliminate structural policy risk.
The "uninvestable" label is fading. China's USD 19 trillion stock market is drawing foreign inflows again after a three-year drought.51 Whether this represents a genuine structural turn or another cyclical rally that will be unwound by the next policy shock remains the central question for allocators.
Appendix: Data Tables & Methodology Notes
SSE Composite Annual Closing Levels (1991-2025)
| Year | Close | Change (%) | Year | Close | Change (%) | |
|---|---|---|---|---|---|---|
| 1991 | 293 | +129.4 | 2009 | 3,277 | +80.0 | |
| 1992 | 780 | +166.6 | 2010 | 2,808 | -14.3 | |
| 1993 | 834 | +6.8 | 2011 | 2,199 | -21.7 | |
| 1994 | 648 | -22.3 | 2012 | 2,269 | +3.2 | |
| 1995 | 555 | -14.3 | 2013 | 2,116 | -6.7 | |
| 1996 | 917 | +65.1 | 2014 | 3,235 | +52.9 | |
| 1997 | 1,194 | +30.2 | 2015 | 3,539 | +9.4 | |
| 1998 | 1,147 | -4.0 | 2016 | 3,104 | -12.3 | |
| 1999 | 1,367 | +19.2 | 2017 | 3,307 | +6.6 | |
| 2000 | 2,073 | +51.7 | 2018 | 2,494 | -24.6 | |
| 2001 | 1,646 | -20.6 | 2019 | 3,050 | +22.3 | |
| 2002 | 1,358 | -17.5 | 2020 | 3,473 | +13.9 | |
| 2003 | 1,497 | +10.3 | 2021 | 3,640 | +4.8 | |
| 2004 | 1,267 | -15.4 | 2022 | 3,089 | -15.0 | |
| 2005 | 1,161 | -8.3 | 2023 | 2,975 | -3.7 | |
| 2006 | 2,675 | +130.4 | 2024 | 3,352 | +12.7 | |
| 2007 | 5,262 | +96.7 | 2025 | 3,969 | +18.4 | |
| 2008 | 1,821 | -65.4 |
Methodology
Market capitalization figures and index levels are sourced from exchange publications, Bloomberg, and Reuters, cross-referenced against Wikipedia annual return tables and ETF fact sheets. Company market caps are approximate as of Q1 2026 and are sourced from CompaniesMarketCap.com and company filings. Sector weights are from the Xtrackers ASHR ETF fact sheet (September 2025) and MSCI index fact sheets (January 2026). Historical event dates and index levels are sourced from financial journalism (Financial Times, Bloomberg, Caixin, SCMP, CNBC) and academic studies. All figures are in USD unless otherwise stated.
-
China Daily, "A-Share Market Surges Past 100 Trillion Yuan," August 2025; People's Daily, "Market Cap of China's High-Tech Firms Surges in 2025," January 2026. ↩
-
Xtrackers Harvest CSI 300 China A-Shares ETF (ASHR) fact sheet, September 2025; MSCI China A Index factsheet, January 2026. ↩↩↩
-
Bloomberg, "BYD Sells 4.6 Million Vehicles in 2025," January 2026; CnEVPost, "Global EV Battery Market Share in 2025," February 2026. ↩↩
-
SSE Composite Index annual return data, Wikipedia; MacroTrends historical chart data. ↩↩
-
Bloomberg, "Foreign Investors Flee Chinese Shares -- Long-Delayed Data Shows," February 2024; HKEX Stock Connect statistics. ↩↩
-
Goldman Sachs, "Continued Growth for Chinese Stocks in 2026," SCMP, 2026; KraneShares 2026 China Outlook. ↩↩
-
Wikipedia, "Shanghai Stock Exchange" -- earliest securities trading records, June 1866. ↩
-
Wikipedia, "Shanghai Rubber Stock Market Crisis"; SAFE Frankfurt Working Paper on the 1910 rubber bubble. ↩
-
Yale School of Management, Shanghai Stock Exchange Project; Goldman Sachs Historical Moments, "The Shanghai Stock Exchange Reopens in 1990." ↩
-
Congressional Research Service, "China's Economic Rise: History, Trends, Challenges" (RL33534). ↩
-
Our China Story, "Shanghai Stock Exchange Established"; ChinaFile, "China Plays the Market." ↩
-
Goldman Sachs Historical Moments; The China Project, "Something Old, Something New: The 1990 Re-opening." ↩
-
ChinaFile, "China Plays the Market" -- Yuyuan stock price surge and Special Steel Tubing debut. ↩
-
Cambridge University Press, "Law and Economic Growth in China: A Case-Study of the Stock Market." ↩
-
Norton Rose Fulbright, "China's VIE Regulations and Recent Developments"; Winston & Strawn, "Understanding China's VIEs." ↩
-
National Law Review, "CSRC Expanding Registration-Based IPO Regime"; China Briefing, "China's IPO Reforms." ↩
-
CNBC, "Chinese Securities Regulator Suspends Circuit Breakers," January 2016; World Finance, "China Scraps Circuit Breaker." ↩
-
CNBC, "Short Positions in China Stocks Shrink After Regulatory Crackdown," March 2024; Linklaters, "China Introduces Restrictions on Short Selling." ↩
-
Wikipedia, "Chinese Property Sector Crisis (2020-present)." ↩
-
MSCI China Index factsheet, January 2026. ↩
-
SimplyWall.St China market valuations; CEIC Data China PE ratio; Mondrian Investment Partners, "China A-Shares: Why Now?" ↩
-
S&P Global, "The World's Largest Banks by Assets, 2025"; CompaniesMarketCap.com for individual bank valuations. ↩
-
S&P Global, "Ping An, China Life Yield Highest Q4 2025 Total Returns Among APAC Insurers." ↩
-
Caixin Global, "In Depth: Why China's Banks Are Stock Market Darlings -- for Now," January 2025. ↩
-
Motley Fool, "Best Stock to Buy: Alibaba vs. Tencent," January 2026. ↩
-
Fortune, "Huawei Revenue Exceeded $118B," February 2025; TechWire Asia, "HiSilicon Revenue Doubles." ↩
-
Digitimes, "NAURA Rises to No. 5 in Global Semiconductor Equipment," 2026; TrendForce, "China's Chip Industry Surges in 1H25." ↩
-
Bloomberg, "ByteDance on Track for $50 Billion Profit in 2025," December 2025; TechBuzz AI, "Private Markets Value ByteDance at $550 Billion." ↩
-
Morningstar, "Kweichow Moutai's Competitive Strength"; CompaniesMarketCap.com. ↩
-
CompaniesMarketCap.com for PetroChina, CNOOC, Sinopec, Shenhua valuations; OilPrice.com, "PetroChina Profit Slips From Record." ↩
-
Ember, "China Energy Transition Review 2025"; CompaniesMarketCap.com for Yangtze Power, LONGi. ↩
-
CnEVPost, "Global EV Battery Market Share in 2025"; CarNewsChina, "CATL's Domestic Share Reaches 50.1% in Q1 2026." ↩
-
CompaniesMarketCap.com for CRRC, Sany, AVIC subsidiaries; PitchBook company profiles. ↩
-
CSI 300 Index annual returns, Wikipedia; S&P 500 comparison from MacroTrends. ↩
-
Hang Seng Index annual returns, Wikipedia; Yahoo Finance historical data. ↩
-
MSCI China Index factsheet; Curvo.eu backtest data; MSCI research on country investing. ↩
-
Wikipedia, "Chinese Stock Bubble of 2007"; Nomura, "Reform of China's Split-Share Structure." ↩↩
-
Wikipedia, "Chinese Economic Stimulus Program"; IMF, "A Stronger China." ↩
-
Wikipedia, "2015-2016 Chinese Stock Market Turbulence"; NBER, "Leverage, Fire Sales, and the 2015 Chinese Stock Market Crash." ↩
-
Washington Post, "China Protests After Arrest of Huawei Executive," December 2018; NBER trade war working paper. ↩
-
PLOS One, "COVID-19 and Financial Market Response in China"; GuruFocus CSI 300 data. ↩
-
SCMP, "Timeline of China's 32-Month Big Tech Crackdown"; Fortune, "How Didi's IPO Debacle Doomed China-Wall Street Relations." ↩
-
Wikipedia, "Evergrande Liquidity Crisis"; SCMP, "Chinese Stocks Set for Record Third Year of Losses"; MSCI Stock Connect outflow data. ↩
-
FinanceAsia, "PBOC Offers Stimulus Relief"; China Briefing, "Decoding China's Recent Economic Stimulus Package." ↩
-
Fortune, "DeepSeek Erased Silicon Valley's AI Lead," March 2025; Carnegie Endowment, "What Does Xi's Meeting with Entrepreneurs Mean?" ↩
-
Chambers, "CSRC Unveils Work Plan to Optimize QFI Regime," October 2025; Dechert, "Removal of QFII and RQFII Quotas." ↩
-
HKEX, "Stock Connect 2025 Review"; HKEX, "10 Years of Connect" white paper. ↩
-
MSCI, "China A-Shares: What Have We Learned"; Invesco, "MSCI Index Inclusion Can Wait." ↩
-
PCAOB, "Complete Access to Inspect Chinese Firms," December 2022; Mayer Brown, "HFCAA Disclosure Trends 2024/25." ↩
-
KraneShares, "2026 China Outlook: Year of the Horse"; ING, "10 Questions for China in 2026." ↩
-
Bloomberg, "China Sheds 'Uninvestable' Tag as $2.7 Trillion Gain Draws Inflows," September 2025. ↩